
The journey to work is one of the most measured parts of Irish life and one of the least well summarised. The Census records how every worker travels and for how long, the CSO’s travel survey covers all journeys, Eurostat compares member states, and traffic data shows what happens on the roads into Dublin. This page brings those sources together for journalists, researchers, employers and anyone weighing up a job against the journey it involves. Each figure is labelled with the period it measures, and most of the detailed figures come from the Census of April 2022, which remains the latest full count.
Key commuting statistics for Ireland at a glance
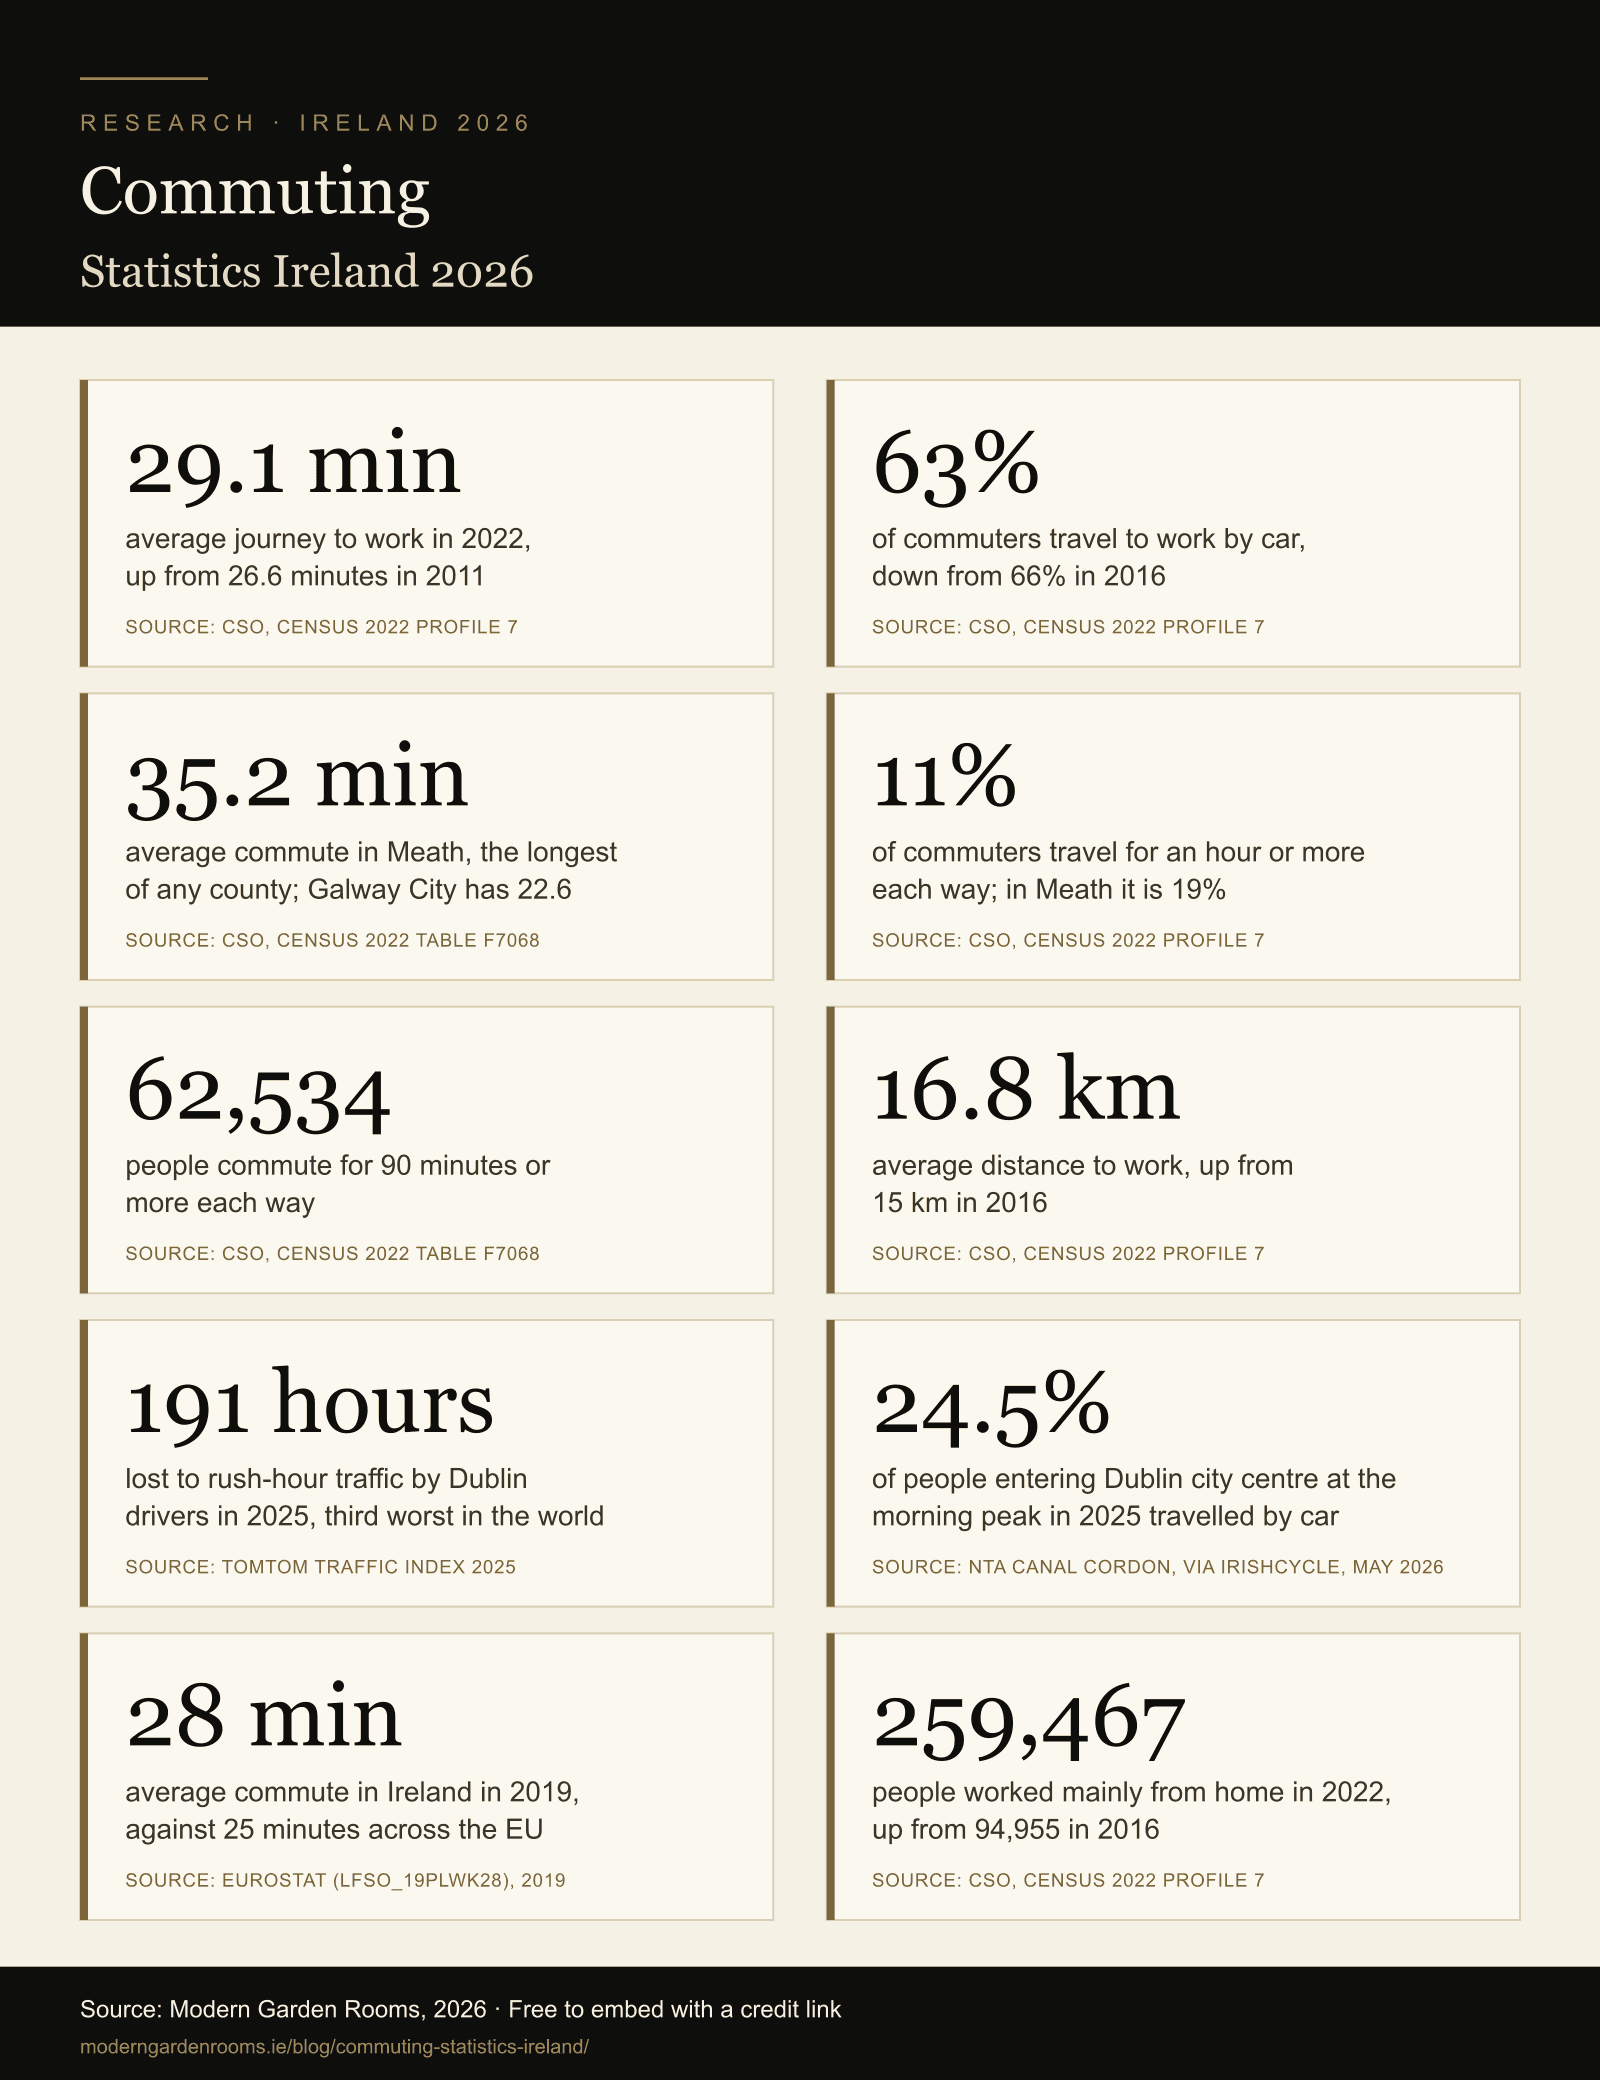
- The average journey to work took 29.1 minutes in 2022, up from 26.6 minutes in 2011. Source: CSO, Census 2022 Profile 7.
- 63% of commuters travelled to work by car, 59% as drivers and 4% as passengers, down from 66% in 2016. Source: CSO, Census 2022 Profile 7.
- Workers in Meath had the longest average commute at 35.2 minutes, and Galway City the shortest at 22.6 minutes. Source: CSO, Census 2022 table F7068.
- 11% of commuters spent an hour or more travelling to work, rising to 19% in Meath, 18% in Wicklow and 17% in Kildare. Source: CSO, Census 2022 Profile 7.
- 62,534 people had a journey to work of 90 minutes or more each way. Source: CSO, Census 2022 table F7068.
- The average distance to work was 16.8 kilometres, up from 15 kilometres in 2016. Source: CSO, Census 2022 Profile 7.
- Nearly a quarter of commuters left home before 7am, and 10% before 6.30am. Source: CSO, Census 2022 Profile 7.
- Dublin drivers lost 191 hours to rush-hour traffic in 2025, and the city ranked third most congested in the world. Source: TomTom Traffic Index 2025.
- The average commute in Ireland was 28 minutes in 2019, against 25 minutes across the EU. Source: Eurostat, table lfso_19plwk28.
- 259,467 people worked mainly from home in 2022, up from 94,955 in 2016. Source: CSO, Census 2022 Profile 7.
Embed This Infographic
This infographic is free to use on your own site. Copy the code below and keep the credit link back to this page.
<a href="https://moderngardenrooms.ie/blog/commuting-statistics-ireland/"><img src="https://moderngardenrooms.ie/images/blog/commuting-statistics-ireland-infographic.png" alt="Commuting Statistics Ireland 2026 infographic by Modern Garden Rooms" width="1200" height="1560" style="max-width:100%;height:auto;border:0;" /></a>
<p>Source: <a href="https://moderngardenrooms.ie/blog/commuting-statistics-ireland/">Commuting Statistics Ireland 2026</a> by Modern Garden Rooms</p>
How people in Ireland get to work
The car dominates. In April 2022, 59% of commuters drove to work and a further 4% travelled as a passenger in a car. The combined share of 63% was down from 66% in 2016. The share of workers who drive rose from 45% in 1986 to a high of 63% in 2011, while the share travelling as passengers fell from 10% in 1986 to 4% in 2022.
Walking was the second most common way to get to work at 9%, down from a high of 15% in 1986. Bus travel accounted for 6%, trains, the DART and the Luas for 3%, and cycling for 3%. Cycling stood at 7% in 1986. Motorbikes accounted for less than 1%.
The mix changes sharply by place. Galway County, at 71%, and Roscommon, at 70%, had the highest shares driving to work, while fewer than 30% of commuters in Dublin City drove. Dublin City had the highest shares walking, at 18%, cycling, at 10%, and travelling by bus, at 15%. Commuters in Dún Laoghaire-Rathdown were the most likely to take a train, DART or Luas, at 15%. Among towns, Donabate in Fingal had the highest rail share at 24%, and Watergrasshill in Cork had the highest share driving at 82%.
The CSO’s Urban and Rural Life in Ireland 2025 release, which excludes people working mainly at home, shows the same divide by type of area. Driving to work ranged from 44.8% of commuters in cities to 73% in rural areas with high urban influence, and outside the cities fewer than 2% of commuters cycled.
How long the journey takes
The average journey to work has lengthened at each of the last three censuses. It rose from 26.6 minutes in 2011 to 29.1 minutes in 2022, and stood at 28.2 minutes in 2016. Men spent longer commuting than women, at 31.2 minutes against 26.9 minutes, and the gap has widened: the average for men rose by 3.3 minutes since 2011 and the average for women by 1.7 minutes.
A journey of 29.1 minutes each way adds up to 58.2 minutes a day, or 4 hours and 51 minutes over a five-day week. Those totals are calculated from the Census average and assume a return journey of the same length.
Public transport journeys are the longest. Trips by train, DART or Luas took an average of 52 minutes and bus trips 45 minutes, compared with 23 minutes by bicycle and 17 minutes on foot. Around half of all journeys to work, 49%, took less than 30 minutes. Among people who drove, 55% had a commute of less than 30 minutes, 32% spent between 30 and 60 minutes, and 10% spent over an hour.
The longest commutes are in the counties around Dublin
Where a worker lives matters more than how they travel. People in Meath had the highest average journey time, followed by Kildare, Wicklow and Fingal, and the shortest commutes were in Galway City. The table below gives the figures to one decimal place from the CSO’s county table. Meath’s average rose by 2.4 minutes between 2011 and 2022 and Louth’s by 2.6 minutes, both calculated from that table. Wicklow is the only area in the table where the average fell between 2016 and 2022.
| Area | 2011 | 2016 | 2022 | Hour or more, 2022 |
|---|---|---|---|---|
| Meath | 32.8 | 34.6 | 35.2 | 19.0% |
| Kildare | 31.6 | 33.8 | 34.0 | 17.2% |
| Wicklow | 32.2 | 34.5 | 33.9 | 18.1% |
| Fingal | 32.1 | 33.4 | 33.7 | 14.7% |
| Laois | 30.4 | 31.9 | 32.3 | 17.2% |
| Dublin City | 27.1 | 28.9 | 29.7 | 7.9% |
| Louth | 26.3 | 27.7 | 28.9 | 14.0% |
| Galway City | 20.2 | 21.7 | 22.6 | 4.4% |
| State | 26.6 | 28.2 | 29.1 | 10.9% |
Source: CSO, Census table F7068, extracted 12 November 2026. The final column is calculated as commuters with a journey of 60 minutes or more divided by all commuters in the area.
Commuters in the counties around the capital also travel furthest. The average distance to work was 16.8 kilometres in 2022, up from 15 kilometres in 2016, measured as a straight line between home and workplace. Commuters in Laois travelled furthest at 25.3 kilometres, followed by Roscommon at 24.9 kilometres, and those in Dublin City travelled the shortest distance at 6.8 kilometres.
Commutes of an hour or more
In 2022, 11% of commuters spent over an hour travelling to work, 13% of men and 8% of women. People aged 25 to 34 were the most likely to have a long commute, at 12%. Meath had the highest share of long commutes at 19%, followed by Wicklow at 18% and Kildare at 17%, while Cork and Galway cities had the lowest at 4%. Dublin City had the largest number of long-distance commuters, at nearly 21,000 people.
The CSO’s county table gives the numbers behind those shares. Across the State, 62,534 people had a journey to work of 90 minutes or more, and 221,889 had a journey of 60 minutes or more when the two longest time bands are added together. The second figure is calculated from the table. In Meath, 17,044 workers travelled for an hour or more, in Kildare 17,395 and in Wicklow 10,600.
Among towns of more than 1,500 people, the share commuting for an hour or more ranged from 3% in Sligo and Newmarket-on-Fergus to 29% in Ballivor in Meath. Laytown-Bettystown in Meath, Kinnegad in Westmeath and Skerries in Fingal each had more than a quarter of commuters travelling for an hour or more.
When commuters leave home
Long journeys mean early starts. Nearly a quarter of all commuters left home before 7am and 10% left before 6.30am. Among bus users, 32% left before 7am, as did 28% of train users and 25% of drivers. People walking or cycling left later, with 54% and 45% respectively leaving after 8am. The CSO’s area analysis found that commuters in satellite urban towns, the commuter belt around the cities, were the most likely to leave before 7am, at 19.7%.
The evening peak is concentrated in 90 minutes. More than 40% of commuters left work between 4.31pm and 6pm, and the single busiest half hour was 4.31pm to 5pm, when 17% left. For rail commuters the busiest half hour was 5.01pm to 5.30pm.
Dublin traffic and the city centre
Dublin’s roads are among the slowest in the world. The TomTom Traffic Index for 2025 ranked Dublin third most congested of the cities it measures, with an average congestion level of 72.9%, up 1.7 percentage points on 2024. Drivers lost 191 hours to rush-hour traffic over the year, which TomTom expresses as 7 days and 23 hours and which was 7 hours and 40 minutes more than in 2024. The average speed was 17.4 kilometres an hour.
Fewer people now drive into the city centre. Preview figures from the annual canal cordon count by the National Transport Authority and Dublin City Council, as reported by IrishCycle in May 2026, show that 198,832 people crossed the canals into the city centre in the morning peak in 2025, up 3.2% on 2024 but 13% below the 2019 peak. Cars carried 24.5% of them, below a quarter for the first time, while buses carried 34%, Irish Rail 17.5% and the Luas 7.7%. Walking accounted for 8.8% and cycling for 4.9%. The final report had not been published at the time of writing.
Many of those commuters start their journey well outside the city. The CSO found that 16.4% of people working in Dublin city and suburbs lived in satellite urban towns and 9.1%, or 45,028 people, came from rural areas.
All journeys, not just the commute
The CSO’s National Travel Survey covers every journey adults make. Its 2024 results, published in July 2026, show that 73.9% of all journeys were made by car, as driver or passenger, slightly above the 73.7% recorded in 2019 and well above the 70.7% recorded in 2021. Walking accounted for 13.6% of journeys, buses for 4.1%, cycling for 2.0% and rail, DART or Luas for 1.4%. The car was the main mode for 75.9% of journeys outside Dublin and 53.6% of journeys in Dublin, and for 77.6% of journeys in thinly populated areas.
Ireland compared with the European Union
Eurostat last measured commuting time across the EU in 2019. The average one-way commute in Ireland was 28 minutes, compared with 25 minutes for the EU as a whole. Long commutes were also more common in Ireland. Of employed people who travelled to work, 12.2% in Ireland had a journey of 60 minutes or more, compared with 8.5% across the EU. Both shares are calculated from the Eurostat table, which counts 224,400 such commuters in Ireland. The data predates the pandemic and has not been repeated.
Working from home has taken commuters off the road
The number of commuters has grown more slowly than the number of jobs. Between 2016 and 2022, the number of people commuting to work rose by 8%, compared with a 16% increase in the number of people at work. The CSO attributes part of the difference to the rise in people working mainly from home, from 94,955 in 2016 to 259,467 in 2022. In cities, 38.4% of workers said they ever worked from home, the highest of any type of area.
The commute remains the norm for most workers. In the second quarter of 2026, 64.8% of people in employment, or 1,839,400 people, said they never work at home, while 990,600 worked from home at least some of the time. Our remote working statistics for Ireland cover that group in detail.
How these statistics were compiled
This page draws on the CSO’s Census 2022 Profile 7 and its county table F7068, the CSO’s Urban and Rural Life in Ireland 2025 and Travel Behaviour Trends 2024 releases, the Labour Force Survey for the second quarter of 2026, Eurostat and the TomTom Traffic Index. Every source was opened and every figure checked on 12 November 2026. Figures described as calculated were worked out from the cited source and are not published by it: the daily and weekly time spent commuting, the changes in county averages, the share commuting an hour or more in each county, the State total commuting 60 minutes or more, and the Ireland and EU shares with a commute of an hour or more.
Three limitations apply. Most of the detailed figures describe April 2022, when some pandemic working patterns were still in place, and the next Census is in April 2027. The canal cordon figures are preview figures taken from a press report, because the final report had not been published. The TomTom index measures drivers using its navigation data and describes road speeds, not the journeys of all commuters.
The page will be updated when the final canal cordon report is published, when TomTom releases its 2026 index in January 2027, and when Census 2027 commuting results appear. The year in the title identifies when the page was last compiled. It does not mean every statistic was measured in 2026.
How Modern Garden Rooms helps
The figures above put a number on what a day at home is worth to a commuter. For the average worker it is close to an hour, and for the 62,534 people with a journey of 90 minutes or more it is at least three hours. The practical question on those days is where the work gets done.
Modern Garden Rooms designs and builds fully insulated garden offices across Dublin and the commuter counties, including Meath, Kildare, Wicklow and Louth. A garden office gives a home-working day a proper desk, a door that closes and a short walk back to the house. A free site visit will confirm what your garden allows.
